- Harbourfront Quantitative Newsletter
- Posts
- Using Skewness and Kurtosis to Enhance Trading and Risk Management
Using Skewness and Kurtosis to Enhance Trading and Risk Management
Practical Applications for Portfolio and Risk Strategies
Skewness is a measure of the asymmetry of a return distribution. In this issue, I’ll discuss the skewness risk premium and how skewness can be used to forecast realized volatility.
In this issue:
Latest Posts
Gold Ratios as Stock Market Predictors (11 min)
Volatility of Volatility: Insights from VVIX (11 min)
Simplicity or Complexity? Rethinking Trading Models in the Age of AI and Machine Learning (10 min)
Low-Volatility Stocks: Reducing Risk Without Sacrificing Returns (11 min)
The Calendar Effects in Volatility Risk Premium (9 min)
Turn AI Hype Into Business Impact
AI is more than just using ChatGPT.
It’s about understanding how the technology works—and applying it in practical ways to solve real business problems.
The AI for Business & Finance Certificate Program from Wall Street Prep + Columbia Business School Exec Ed helps you move beyond the hype.
You’ll demystify today’s most important tools and learn just enough Python to streamline workflows, automate tasks, and make smarter decisions.
No coding experience needed—you’ll get step-by-step guidance from world-class faculty.
👉 Save $300 with code SAVE300.
Skewness of returns is a statistical measure that captures the asymmetry of the distribution of an asset’s returns over a specified period. It is particularly important in risk management and option pricing, where the skewness of returns can affect the valuation of derivatives and the construction of portfolios.
Reference [1] studies the skewness risk premium in the options market. It decomposes the skewness risk premium into two components: jump skewness and leverage skewness risk premia.
Findings
The skewness risk premium (SRP) is distinct from the variance risk premium (VRP), and both are independently priced in the options market.
The study introduces model-free, tradable strategies to replicate realized skewness, decomposed into two components:
Jump Skewness Risk Premium
Leverage Skewness Risk Premium
These strategies dynamically rebalance option and forward positions to track high-frequency realized jump skewness and leverage.
The SRP is generally higher during overnight periods than during regular trading hours—mirroring similar behavior observed in the VRP.
Jump skewness dominates the SRP during market hours, while overnight skewness may capture broader macro or non-U.S. investor risk.
The SRP exhibits countercyclical behavior, becoming more pronounced during periods of market stress or left-tail events.
The study confirms that the SRP and VRP are fundamentally different, supporting the need to treat them separately in portfolio and derivative strategies.
This decomposition provides insights for trading and hedging strategies, offering more granular exposure to tail risk components.
Findings are based on short-maturity S&P 500 options, analyzed both intraday and overnight to capture time-sensitive skewness behavior.
In short, the authors constructed a tradable basket of options to measure the skewness risk premium. This means that this study is model-free.
They reconfirmed that
The skewness risk premium is different from the variance risk premium.
The variance risk premium is compensation for bearing overnight risks.
Reference
[1] Piotr Orłowski , Paul Schneider , Fabio Trojani, On the Nature of (Jump) Skewness Risk Premia, Management Science, Vol 70, No 2
Predicting Realized Volatility Using Skewness and Kurtosis
Realized volatility refers to the actual volatility experienced by a financial asset over a specific period, typically computed using historical price data. By calculating realized volatility, investors and analysts can gain insights into the true level of price variability in the market.
Reference [2] examines whether realized volatility can be forecasted. Specifically, it studies whether realized skewness and kurtosis can be used to forecast realized volatility.
Findings
The study investigates whether realized skewness and kurtosis can improve the prediction of realized volatility for equity assets.
Using data from 452 listed firms on the Pakistan Stock Exchange, the research evaluates both in-sample and out-of-sample forecast performance.
The standard Heterogeneous Autoregressive (HAR) model is extended by incorporating realized skewness and kurtosis into the volatility forecasting framework.
The extended model predicts future realized volatility as a linear function of:
Yesterday’s realized volatility
Average realized volatility over the past week and month
Yesterday’s realized kurtosis
Realized kurtosis is found to significantly enhance forecast accuracy, particularly for short- to medium-term horizons (1, 5, and 22 days ahead).
Realized skewness has less predictive power compared to realized kurtosis but still adds context for modeling tail risk.
These findings suggest that higher-order moments (like kurtosis) contain valuable information beyond basic volatility measures.
The approach supports improved asset allocation and risk-adjusted return forecasting in equity portfolios.
While the study is based on Pakistan’s equity market, the methodology can be generalized to other asset classes and global markets. The paper concluded that stocks’ own realized kurtosis carries meaningful information for stocks’ future volatilities.
Reference
[2] Seema Rehman, Role of realized skewness and kurtosis in predicting volatility, Romanian Journal of Economic Forecasting, 27(1) 2024
Closing Thoughts
Both studies show that incorporating skewness and kurtosis adds valuable insight to volatility analysis. The first study reveals that the skewness risk premium is distinct, tradable, and especially driven by jump risk during market hours. The second shows that realized kurtosis improves short-term volatility forecasts. Together, they highlight the importance of using higher-order moments for better risk management, portfolio decisions, and understanding market behavior.
Educational Video
Understanding Options Skew
Our understanding of skew has evolved significantly over time. Its persistence has had meaningful pricing implications that option investors should understand. During this rebroadcast from the OIC webinar program, OIC instructor Mat Cashman focuses on options skew, explaining the history and methods for conceptualizing, measuring, and trading around skew.
Start learning AI in 2025
Keeping up with AI is hard – we get it!
That’s why over 1M professionals read Superhuman AI to stay ahead.
Get daily AI news, tools, and tutorials
Learn new AI skills you can use at work in 3 mins a day
Become 10X more productive
Volatility Weekly Recap
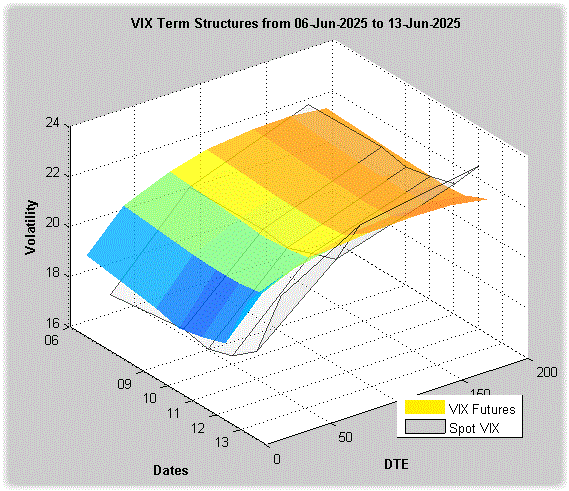
The figure below shows the term structures for the VIX futures (in colour) and the spot VIX (in grey).

Stocks started the week quietly. On Thursday, they pushed slightly higher, but headline news that night about geopolitical conflict sent markets lower on Friday. For the week, large-cap stocks rose 1.6%, mid-cap stocks gained 1.45%, and small-cap stocks advanced 2.12%. Crypto experienced a volatile week. Gold moved higher, supported by positive inflation data.

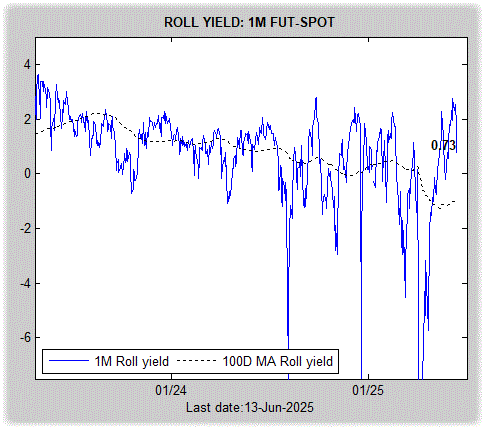
Spot and VIX futures also rose on Friday, though both remain in contango across the short and middle segments of the term structure curve. The roll yield decreased but stayed positive.

Around the Quantosphere
-Banking internships: A complete guide to summer analyst programs (efinancialcareers)
-Crypto has killed the weekend: Hedge funds quietly scramble to adapt (Tradingview)
-Are machines smarter than venture capitalists? (Ft)
-Quant Firm’s $1 Billion Code Is Focus of Rare Criminal Case (Bloomberg)
-Retail Quants May Be the Next Stabilizing Force for Markets (Bloomberg)
-Event-driven and equity hedge funds drive May gains (Hedgeweek)
- Analysis-Trend hedge funds struggle as more nimble macro funds embrace whipsawing markets (whtc)
Disclaimer
This newsletter is not investment advice. It is provided solely for entertainment and educational purposes. Always consult a financial professional before making any investment decisions.
We are not responsible for any outcomes arising from the use of the content and codes provided in the outbound links. By continuing to read this newsletter, you acknowledge and agree to this disclaimer.

